University Website Usability Study:
Forging Design on Data
Intro
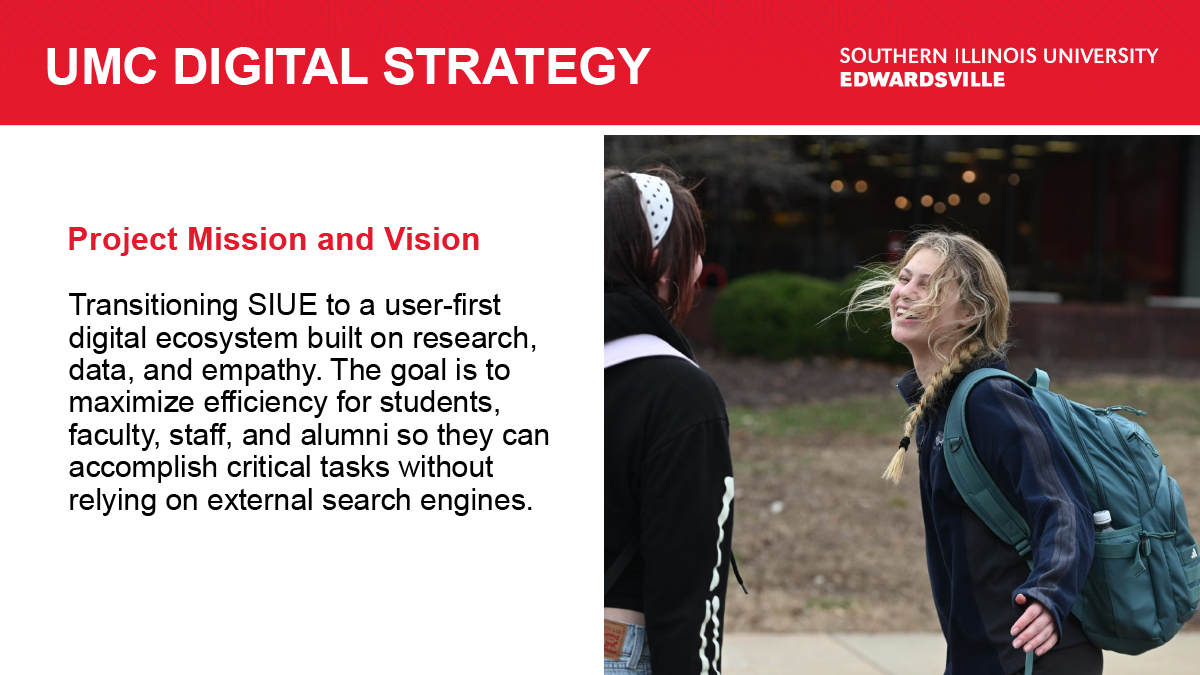
To transition SIUE toward a user-first digital ecosystem, I launched a comprehensive usability initiative grounded in ethical rigor and data-driven insights. By leveraging my IRB Social Behavioral Certification, I established a research framework that reached 748 participants, transforming anecdotal feedback into a strategic roadmap for the university’s future development.
Research Plan
Intro
At SIUE, we are committed to moving to a user-first approach for our entire digital
ecosystem. This means prioritizing your needs and feedback—whether you are a student,
faculty member, staff member, or alumni—to ensure our website is intuitive, accessible, and effective.
The goal of this initiative is simple: to create a website experience that is driven by
research, informed by data, and built with empathy. By helping you accomplish your goals
quickly and easily, we will ultimately benefit the entire university community.
Primary Research Goals
To guide this process, we are collecting feedback across several key areas:
Identifying Pain Points: We want to find and fix any problems or confusion you experience when navigating our site.
Understanding Differences: We aim to understand how the needs of our students, faculty, staff, and alumni differ to serve each group effectively.
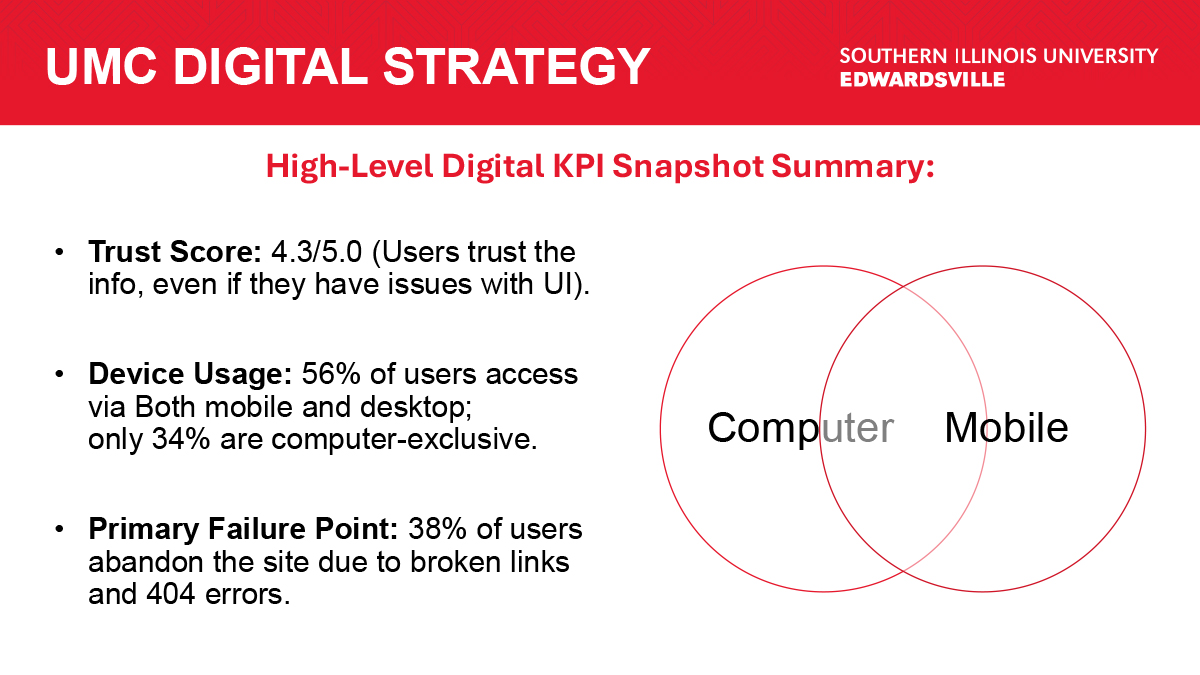
Accessibility and Mobile: We are focused on ensuring a seamless experience regardless
of the device you use (mobile or desktop), and building accessibility into the forethought
of our design.
Measuring Efficiency: We will quantify how easily you can complete key tasks and identify any roadblocks that force you to rely on external resources.
While our marketing research has defined the entire scope of our audience, for research
purposes, we have consolidated them into six primary groups. Our initial surveys will focus
on our primary user base of students, alumni, faculty, and staff. Once our resources have
increased and we can support expanded research, we will introduce more users.
User Groups
- Students or prospective students of SIUE (Initial research covers the former)
- Faculty
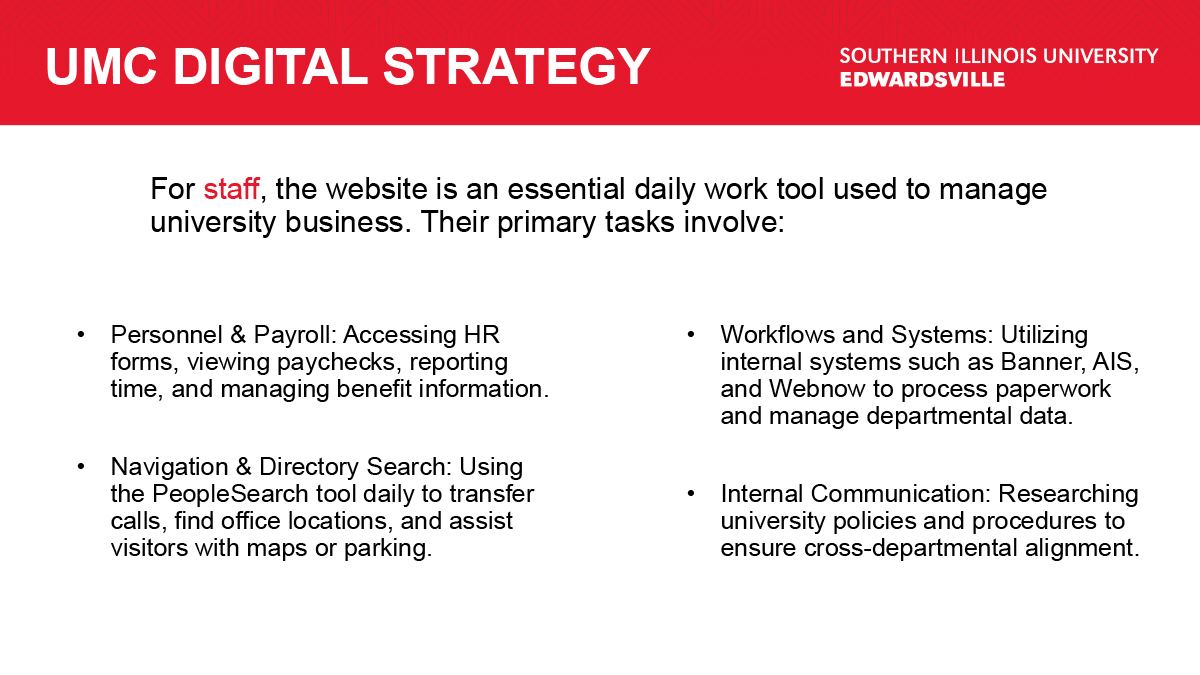
- Staff
- Alumni
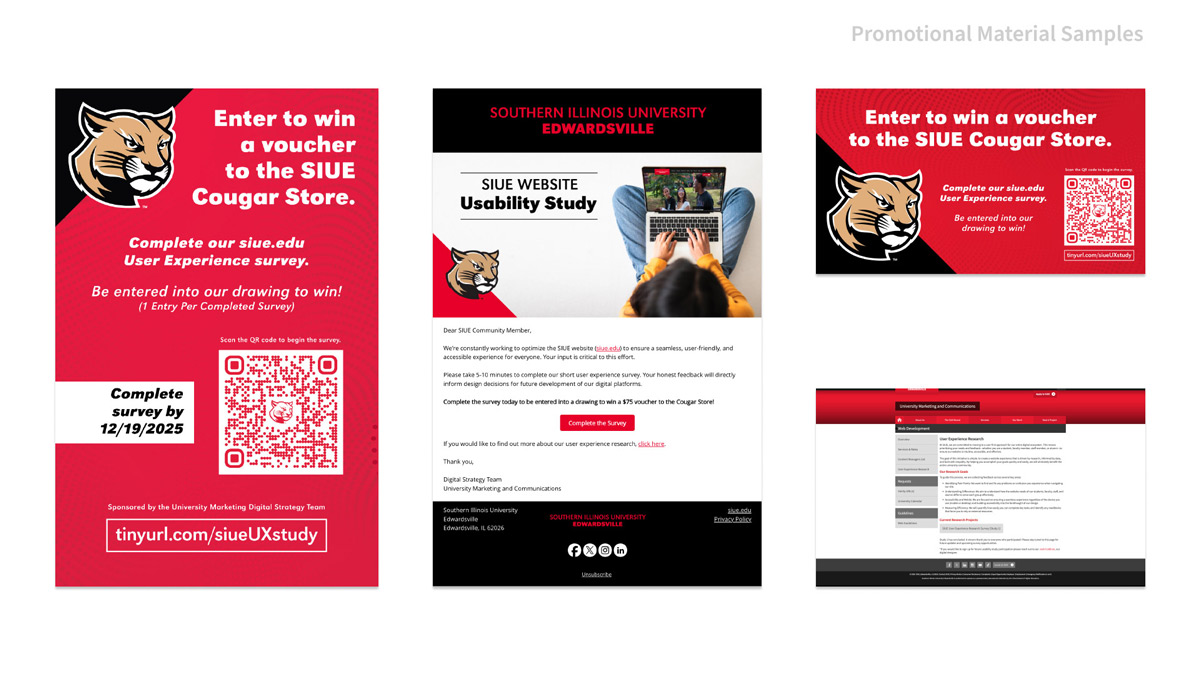
Survey Distribution
Email: Alumni Association, UMC Student Outreach, Faculty, E-Today (Internal Newsletter)
Social Media: Story Post
Posters around campus: Approved by Kimmel engagement
Digital Signs: 39 standard screens + Engineering Building Projection
Graduate Assistant: Finds and guides participants through a survey on campus with an iPad.
UMC UX Research Portal: https://www.siue.edu/marketing-and-communications/ser vices/web/user-experience.shtml
Survey Reward
For completing the survey, the participants are given the option to access another survey
to enter for a single random drawing, as well as opt in for future research communications.
Prize: Cougar Store Prize
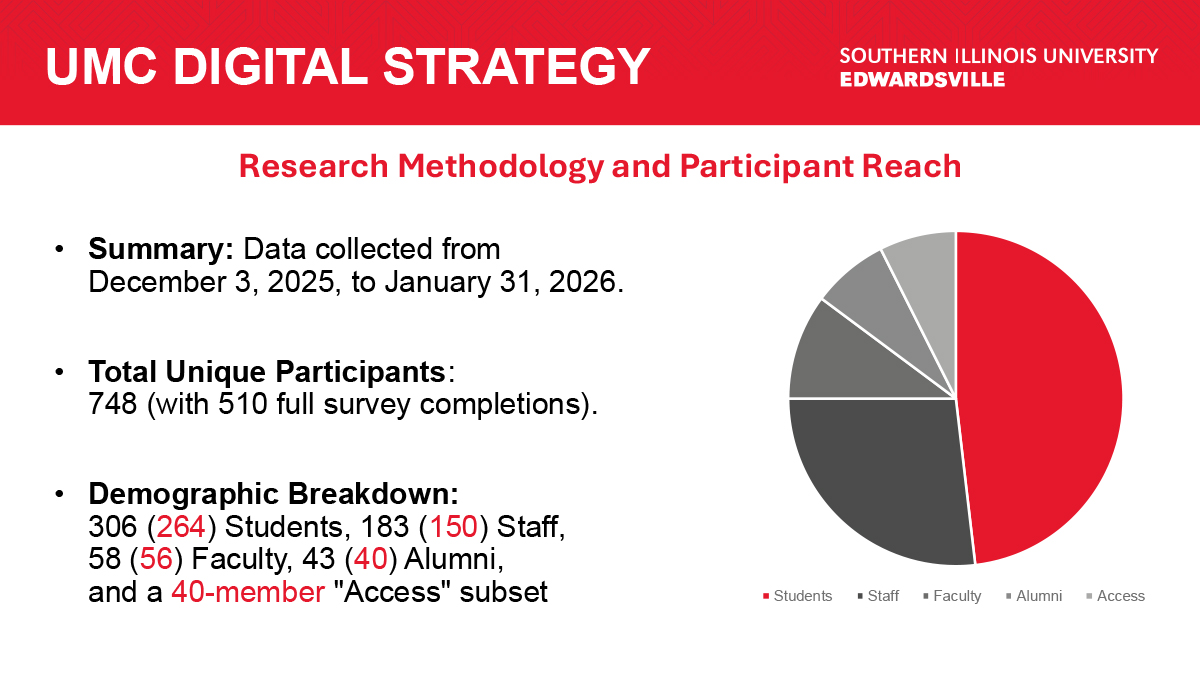
Survey Time Period: Survey is active from Dec 03, 2025, to Jan 31, 2026.
Data Collection & Privacy
Ethics: Adherence to IRB best practices and active bias mitigation.
Anonymity: Participant identifiers (IP Addresss) are decoupled from research data. Incentives and follow-up polls are handled through separate, secure systems to ensure a “blind” data analysis.
Analysis: Data is processed via specialized research tools and compiled by the Lead UX
Researcher.
Reporting Pipeline: Findings undergo a primary review with the Digital Strategy team
before a final report is delivered to University Marketing.
Governance: External data sharing is determined at the University Marketing Group level.
Externally shared data can be found on the UMC UX Research webpage.
Collaborative Efforts
Since this was outward-facing material that would represent the university, I collaborated across different teams. This collaboration also fostered mass adoption by introducing more team members to the UX process and allowing them to provide input. I first worked with my Digital Strategy team to see what other data points could be useful for them as well as review the questions I developed.
- Digital Strategy: Verified technical data points to ensure research is aligned with backend capabilities.
- University Marketing: Unified tone of voice and secured drawing incentives to maximize participation.
- Newsroom/Social: Orchestrated a multi-channel distribution strategy reaching alumni and students.
- Field Research (GA): Managed boots-on-the-ground iPad recruitment of on-campus feedback.

Question Development
I had to set criteria for my questions as well as the cognitive load on the survey participant. I wanted deeper answers than a multiple-choice might provide, but I also wanted as many surveys completed as possible. I balanced fill-in-the-blank response questions with questions rated on a scale or multiple choice to give participants breaks between the larger questions. To encourage survey completion, we offered a chance to be entered into a drawing, which was also heavily promoted through the distribution channels.
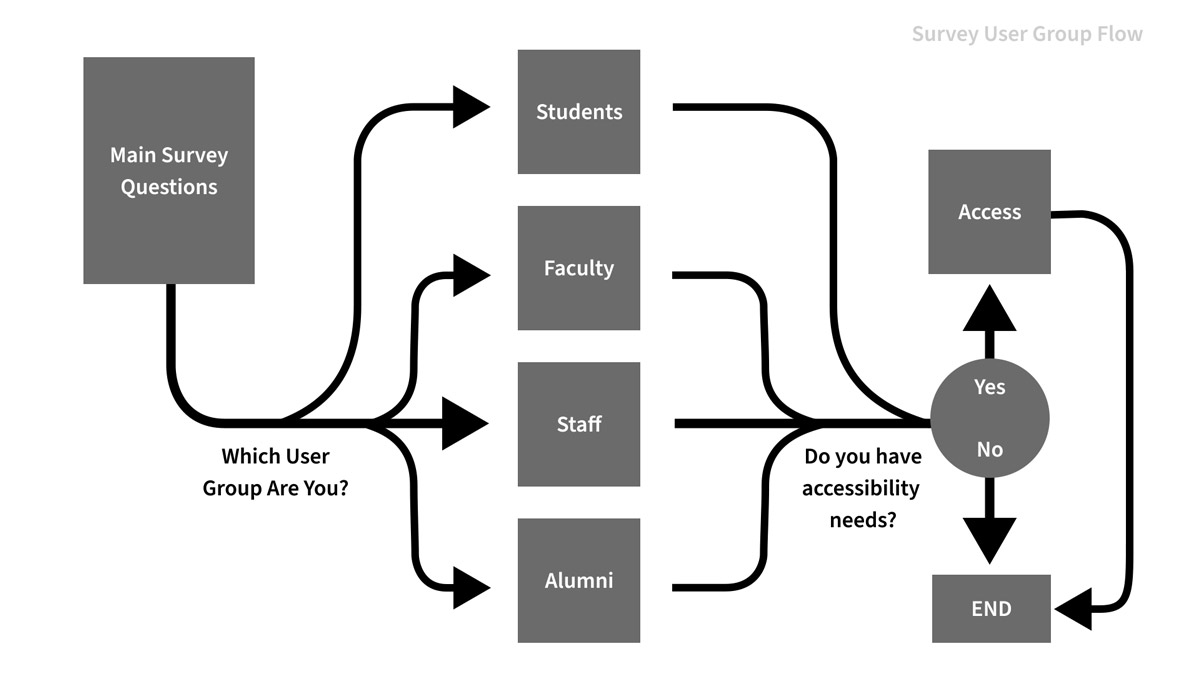
The survey was handled through Qualtrics and had branching paths with question sets for each user group. It also supports accessibility tools. I culled questions down to what was essential to each user group. The survey lacked any place to log their identifying data, except for the IP address, which is removed from the data set once processed. Survey contest entries were handled in a secondary survey meant to keep the data sets separate.
| Sample Question(s) | Option(s) for Answers | User Group |
|---|---|---|
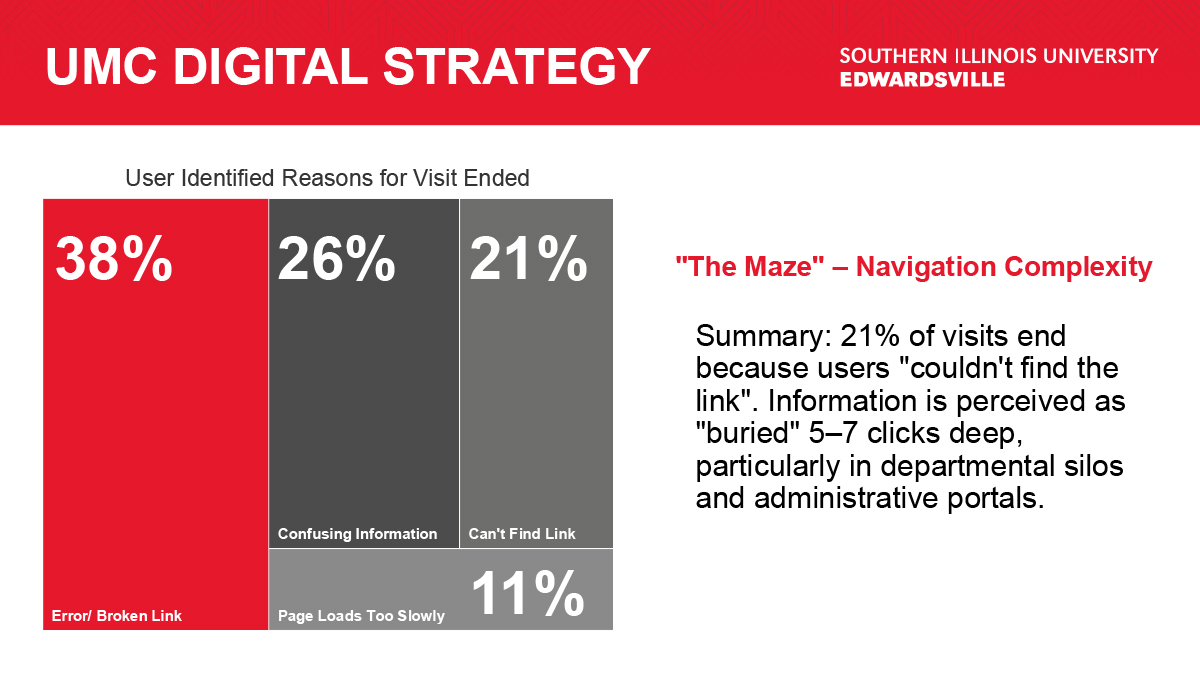
| When accessing the website, what is the most common reason your visit ends without achieving your goal? (Select all that apply) |
|
ALL |
| If you could change one thing about the SIUE Website, what would it be? | (Form field) | ALL |
| Are you a student, faculty, staff, or alumnus? |
|
ALL |
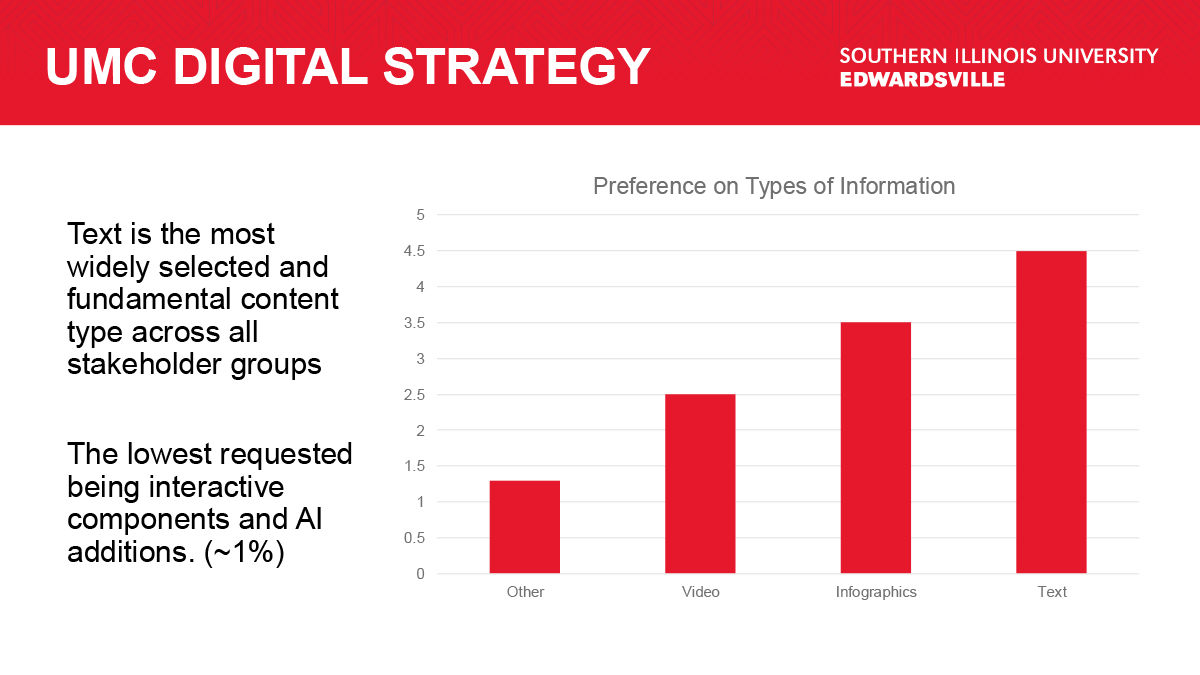
| What kind of content would you be most likely to consume to get the information you need? (Select all that apply) |
|
Students |
|
Do you feel the alumni content on the website is relevant to your needs? |
(Form field) | Alumni |
| Do you ever guide students through parts of the site? Where do they usually struggle? | (Form field) | Faculty |
| If you could automate or simplify one workflow through the website, what would it be? | (Form field) | Staff |
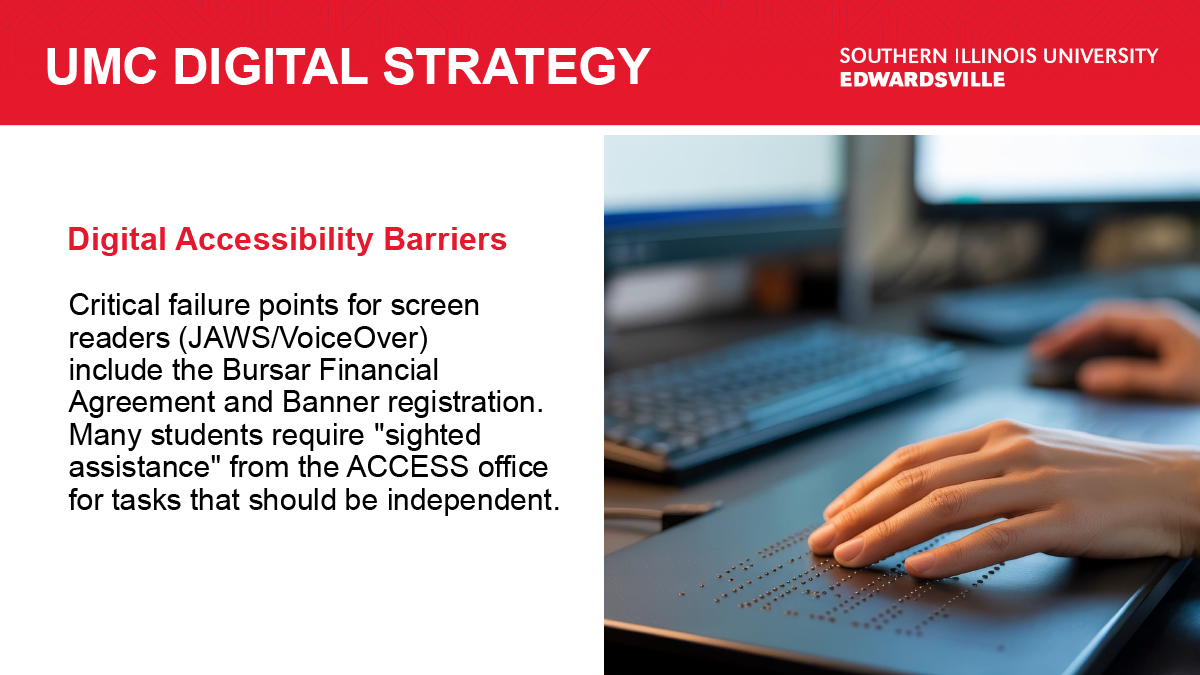
| Have you encountered any specific issues or conflicts (e.g., broken screen reader labels, keyboard traps) between your assistive tools and the SIUE website? If so, please list the problems. | (Form field) | Access |
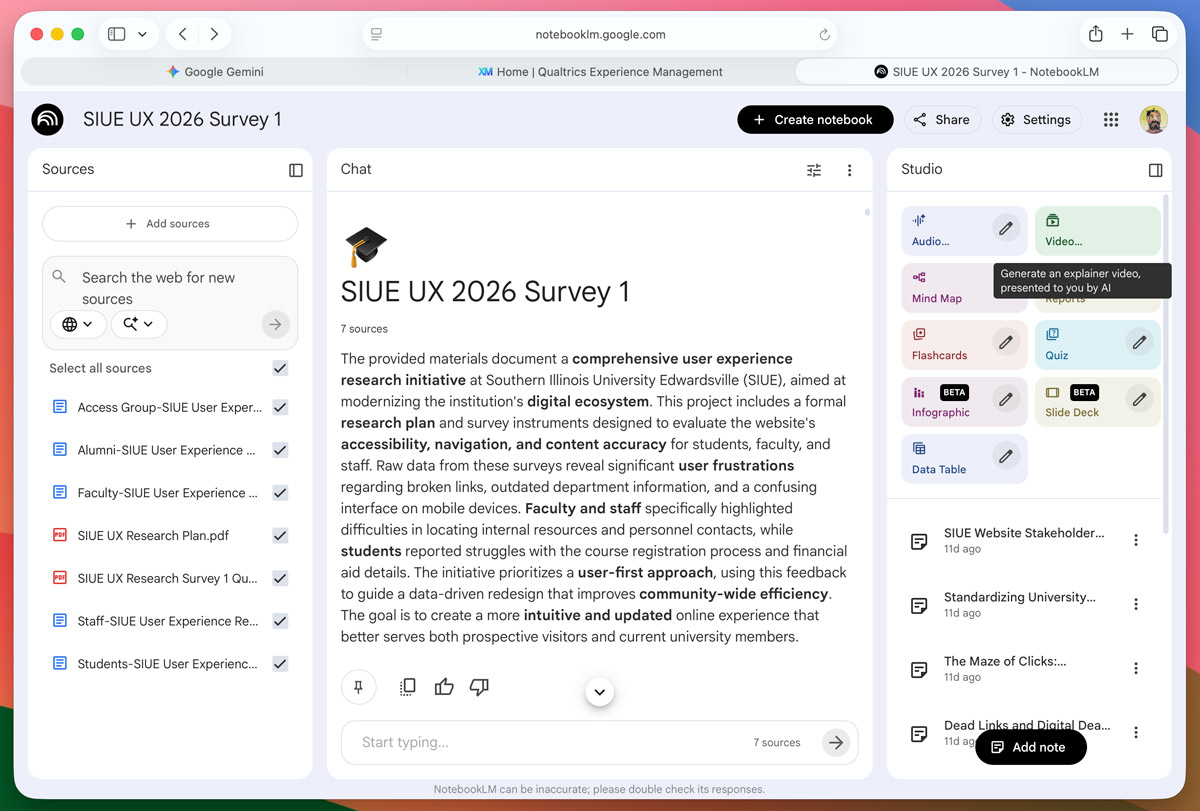
Handling Large Numbers of Participants with NotebookLM & Processing Quality Assurance
We got many more participants than expected. We had hoped to break 100, but ended up with 748 with 510 complete surveys across our user groups. I leveraged my certificate in Responsible Research Conduct to approach the completed surveys. To handle this data, I utilized NotebookLM, an AI designed to handle research of only items fed into it. After removing any identifying information, I then broke up my data into files for each user group in CSV files. I then added PDFs of my research plan and survey questions. Since AI can hallucinate, and I wanted to make sure the system was working properly, I first began testing the quality of how the data was interpreted.
- How many of “X” group?
- Give a specific response to “X” question?
- Summarize “X” data?
- Where did those who did not complete their survey fall off?
- Summarize responses to a small user group where I can manually confirm these themes.
- How many participants provided feedback relating to this specific summary?
After I felt confident in the data in NotebookLM, I began trying to answer my research goals. I then went through each question to determine if there were enough valid responses and to summarize trends. After this I put my prompts and research questions into Gemini to brainstorm more questions to ask about this data. Lastly, I tested the validity of these trends by asking for specific participant counts who responded a certain way. This raised one concern where LM suggested a trend that users hated a specific interface. Once I tested this, I found a single user made this claim, which made that an edge case that may have little to no bearing on my suggestions moving forward. I still cataloged these edge cases for something to continue in future research.
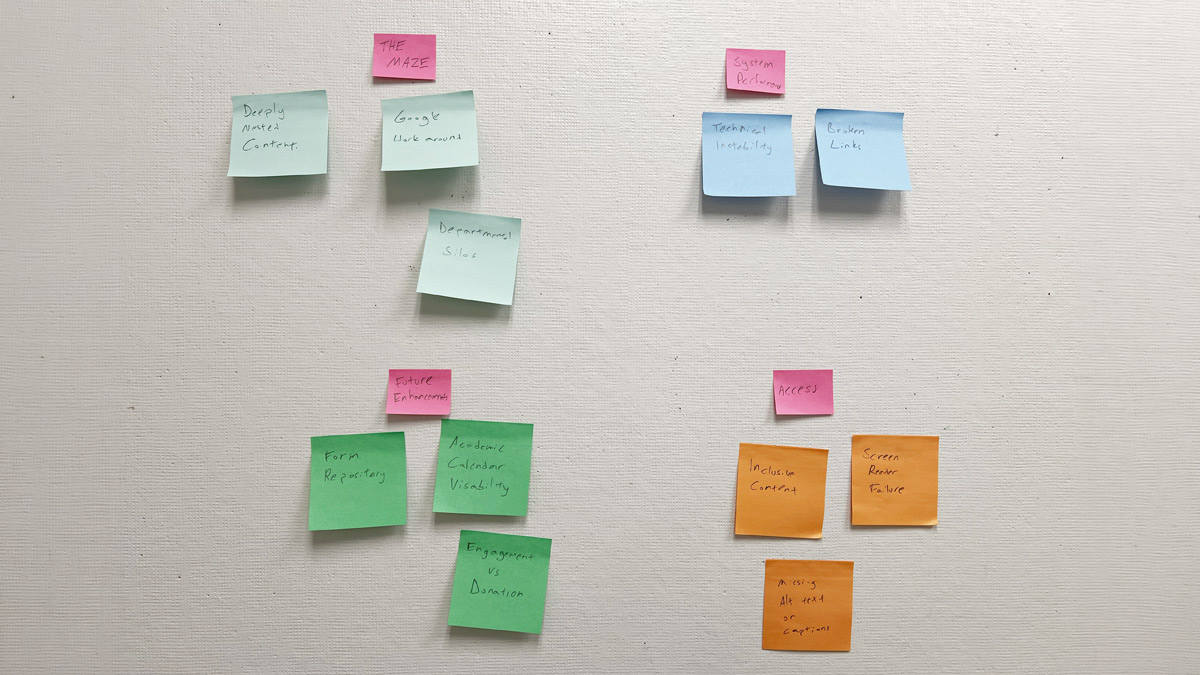
Data Summary
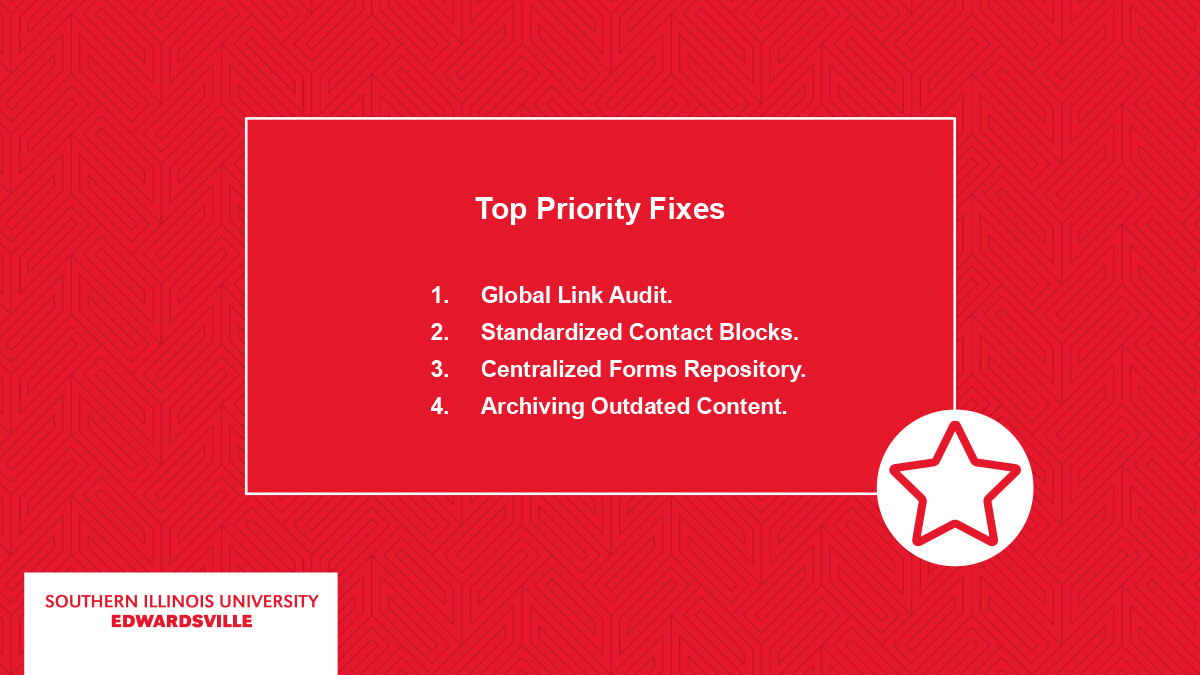
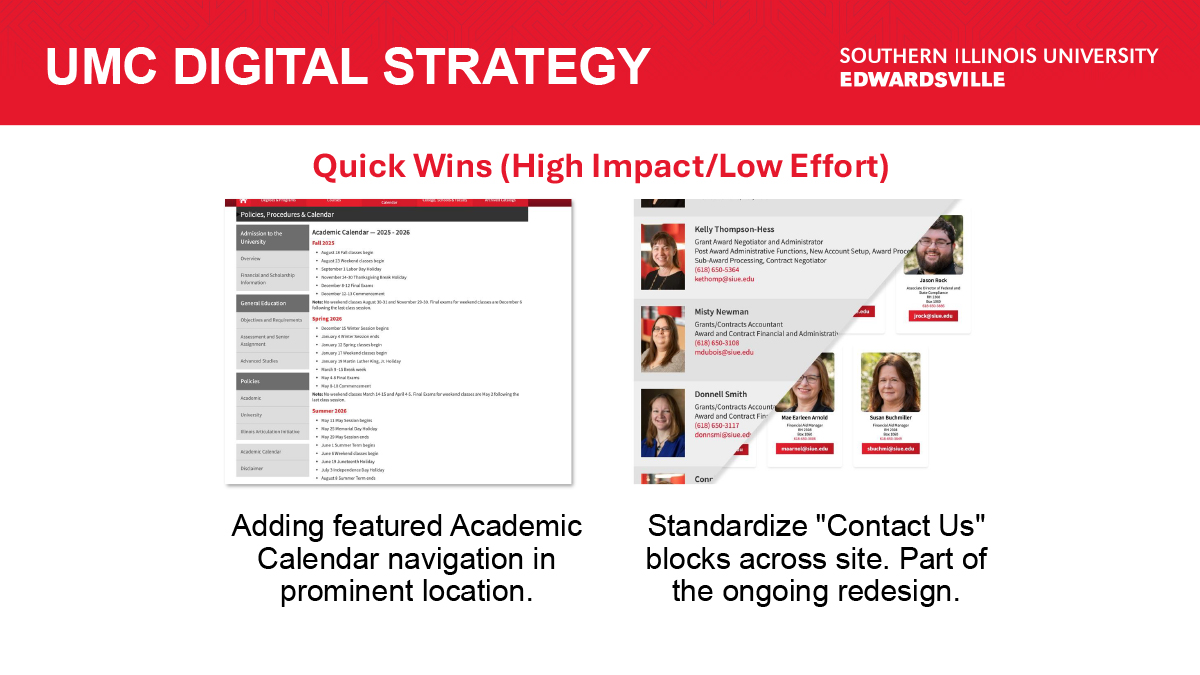
I took all the data and then organized it into charts and summaries that could be best convey the findings to my team. I wanted to answer my big questions, but also make sure I brought answers to questions they had about the study. With this information I built a slide deck that told the story from the goals and information we gained from this study. From all this information I was able to create quick wins where we could solve some of the users’ problems easily, and the long-term goals that we can start working towards. The research supported some of the developments that are already in place, showing we are moving in the right direction. This research also informs my web guidelines and best practices, informed new designs, and helps us resolve issues with users abandoning the site.
Personas
| Persona | Goal | Primary Friction |
|---|---|---|
| The Academic Guide (Faculty) | Direct students to resources quickly. | Outdated information and broken internal links. |
|
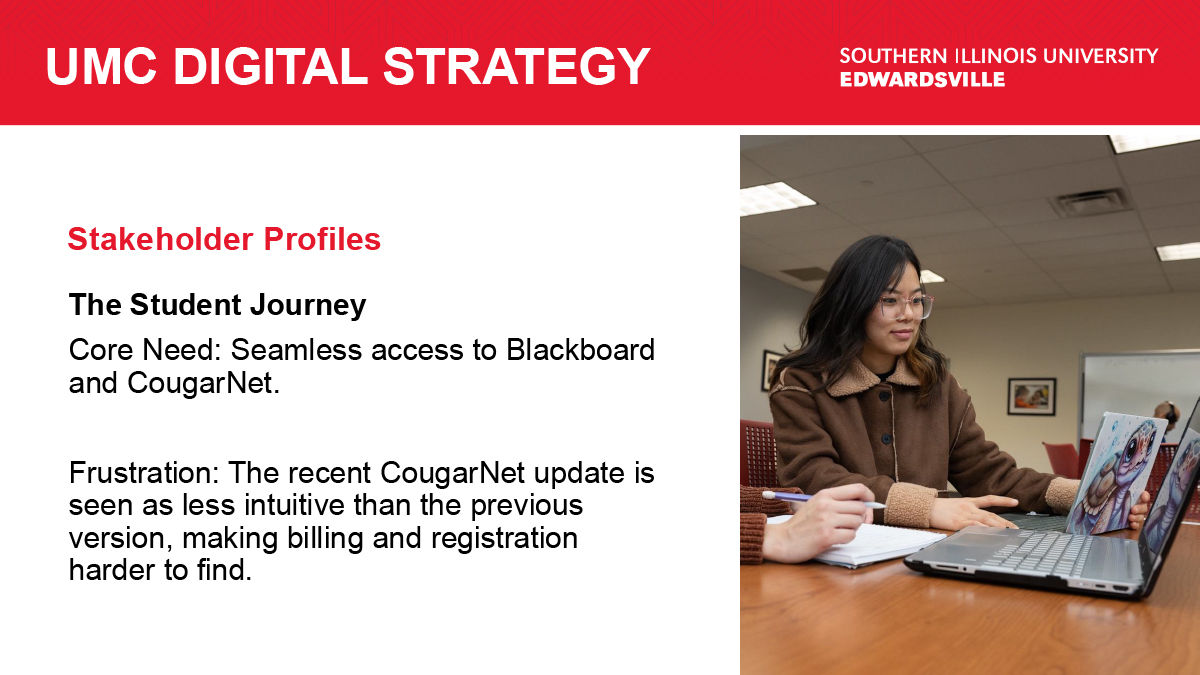
The Goal-Oriented Student |
Access grades, schedules, or financial aid. | Must use google to search for pages needed. |
| The Inclusive User (Accessibility) | Navigate via screen readers or assistive tech. | 3rd party applications sometimes have hangups with screen readers. |
| The Utility Employee (Staff) | Complete mandatory tasks and research. | Outdated policy information. |
Impact and Reflection
From this experience, I gained insight into how users use our products, what their goals are, and their pain points. Here, I was able to produce a slide deck to show my team as well as data that will help influence future developments. I took away experience with new tools to support my research and established a program that will have a ripple effect on other teams and their 3rd party applications, as well as defining essential pillars of things I will implement to help our various user bases reach their goals. This initiative didn’t just solve immediate web issues; it established the SIUE UX Governance Model, ensuring that all future 3rd-party integrations and internal designs are vetted against real-world user data.